- Bitcoin price looks set for a downturn as it fails to overcome a key resistance level at around $62,000.
- Coinglass data shows that Bitcoin Spot ETFs recorded their second consecutive day of slight inflows this week.
- On-chain data suggests dormant wallets are getting active, signaling a bearish move ahead.
Bitcoin’s (BTC) price rose slightly during Asian trading hours on Wednesday, approaching the critical resistance zone around $62,000. Coinglass data shows a second consecutive day of slight inflows into US-listed Bitcoin Spot ETFs, but BTC seems unable to overcome a key resistance level and on-chain data indicates increased activity in dormant wallets that suggests a potential bearish shift ahead.
Daily digest market movers: Bitcoin struggles around $60,000 as on-chain data shows negative bias
- According to data from Coinglass, Bitcoin Spot ETFs recorded their second consecutive day of inflows this week, with slight inflows of $39 million on Tuesday and $27.8 million on Monday. This highlights the importance of monitoring these net flows to gauge market dynamics and investor sentiment. Still, these inflows are very small taking into account that the total Bitcoin reserves held by the 11 US spot Bitcoin ETFs are now at $53.82 billion.

Bitcoin Spot ETF Net Inflow (USD) chart
- According to CryptoQuant data, the correlation between the German investment fund ETC Group Physical Bitcoin (BTCE) and the Bitcoin price has shown a consistent pattern, where changes in the fund’s reserves generally precede movements in BTC price. For instance, in 2020, as BTCE’s holdings surged from 0 to 23,480 BTC, Bitcoin’s price peaked in April 2021. Conversely, BTCE’s reserves declines often corresponded with drops in Bitcoin prices.
- Since January, despite a significant drop in BTCE’s holdings from 27,980 BTC to below 17,000 BTC, Bitcoin’s price has yet to reflect this trend, indicating that if this pattern persists, Bitcoin’s price may face declines in the near future.

BTC Fund Holdings chart
- Additionally, CryptoQuant data shows a recent surge in activity among long-dormant Bitcoin holdings, which has previously been a source of market volatility. On Sunday, 18,536 BTC that had been inactive for 2 to 3 years were moved on-chain, which generally contributed to downward price pressure as investors realized their profits. This was followed by 5,684 BTC that had been inactive for 3 to 6 months. The trend continued on Monday with the transfer of 2,588 BTC dormant for 6-12 months and 2,394 BTC held for 3 to 5 years, and 2,398 BTC from 3 to 6 months of inactivity. Such movements often lead to increased selling pressure, and in times of low liquidity, this can exacerbate downward price trends, potentially impacting Bitcoin’s price further.

Bitcoin Spend Output Age Bands chart
Technical analysis: Approaching key resistance of around $62,000
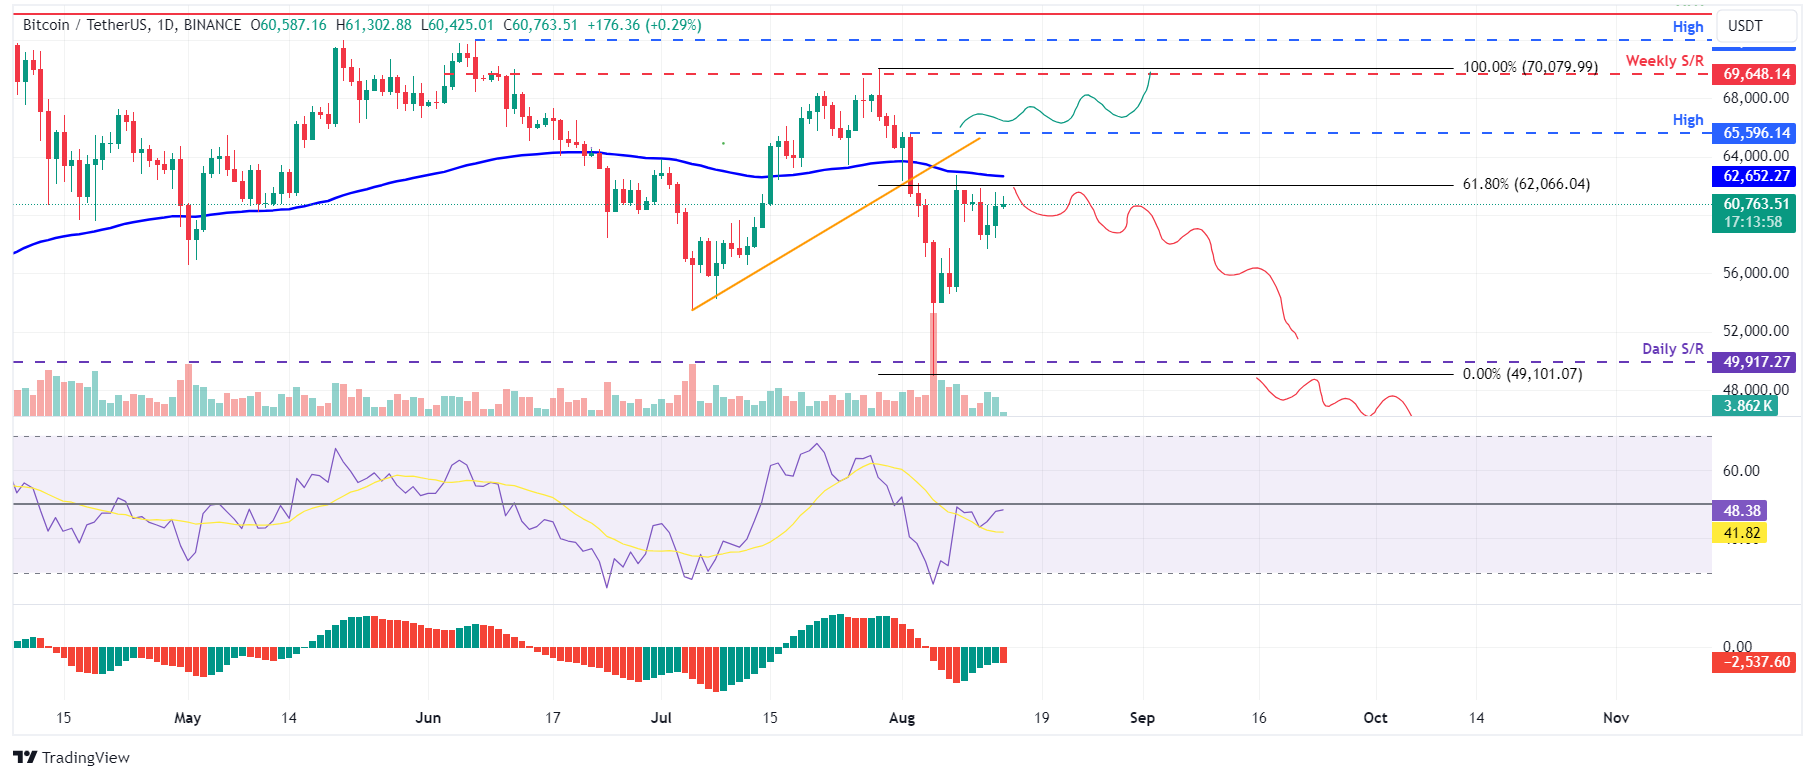
Bitcoin price has consistently faced resistance at the 61.8{3da602ca2e5ba97d747a870ebcce8c95d74f6ad8c291505a4dfd45401c18df38} Fibonacci retracement level of $62,066, drawn from the swing high of $70,079 on July 29 to the low of $49,101 on August 5. As of Wednesday, it is trading up by 0.3{3da602ca2e5ba97d747a870ebcce8c95d74f6ad8c291505a4dfd45401c18df38} at $60,763, having reached a high of $61,357 during the Asian session.
If the 61.8{3da602ca2e5ba97d747a870ebcce8c95d74f6ad8c291505a4dfd45401c18df38} Fibonacci retracement level at $62,066 continues to act as resistance, in conjunction with the broken trendline and the 100-day Exponential Moving Average at around $62,652, selling pressure could increase.
A failure to break above $62,066 might result in an almost 20{3da602ca2e5ba97d747a870ebcce8c95d74f6ad8c291505a4dfd45401c18df38} decline, potentially testing the daily support level of $49,917.
On the daily chart, the Relative Strength Index (RSI) and Awesome Oscillator (AO) trade below their neutral levels of 50 and zero, respectively, suggesting an impending bearish trend.

BTC/USDT daily chart
However, if Bitcoin closes above the August 2 high of $65,596, it would set a higher high on the daily chart, possibly leading to a 6{3da602ca2e5ba97d747a870ebcce8c95d74f6ad8c291505a4dfd45401c18df38} price increase and testing the weekly resistance at $69,648.


